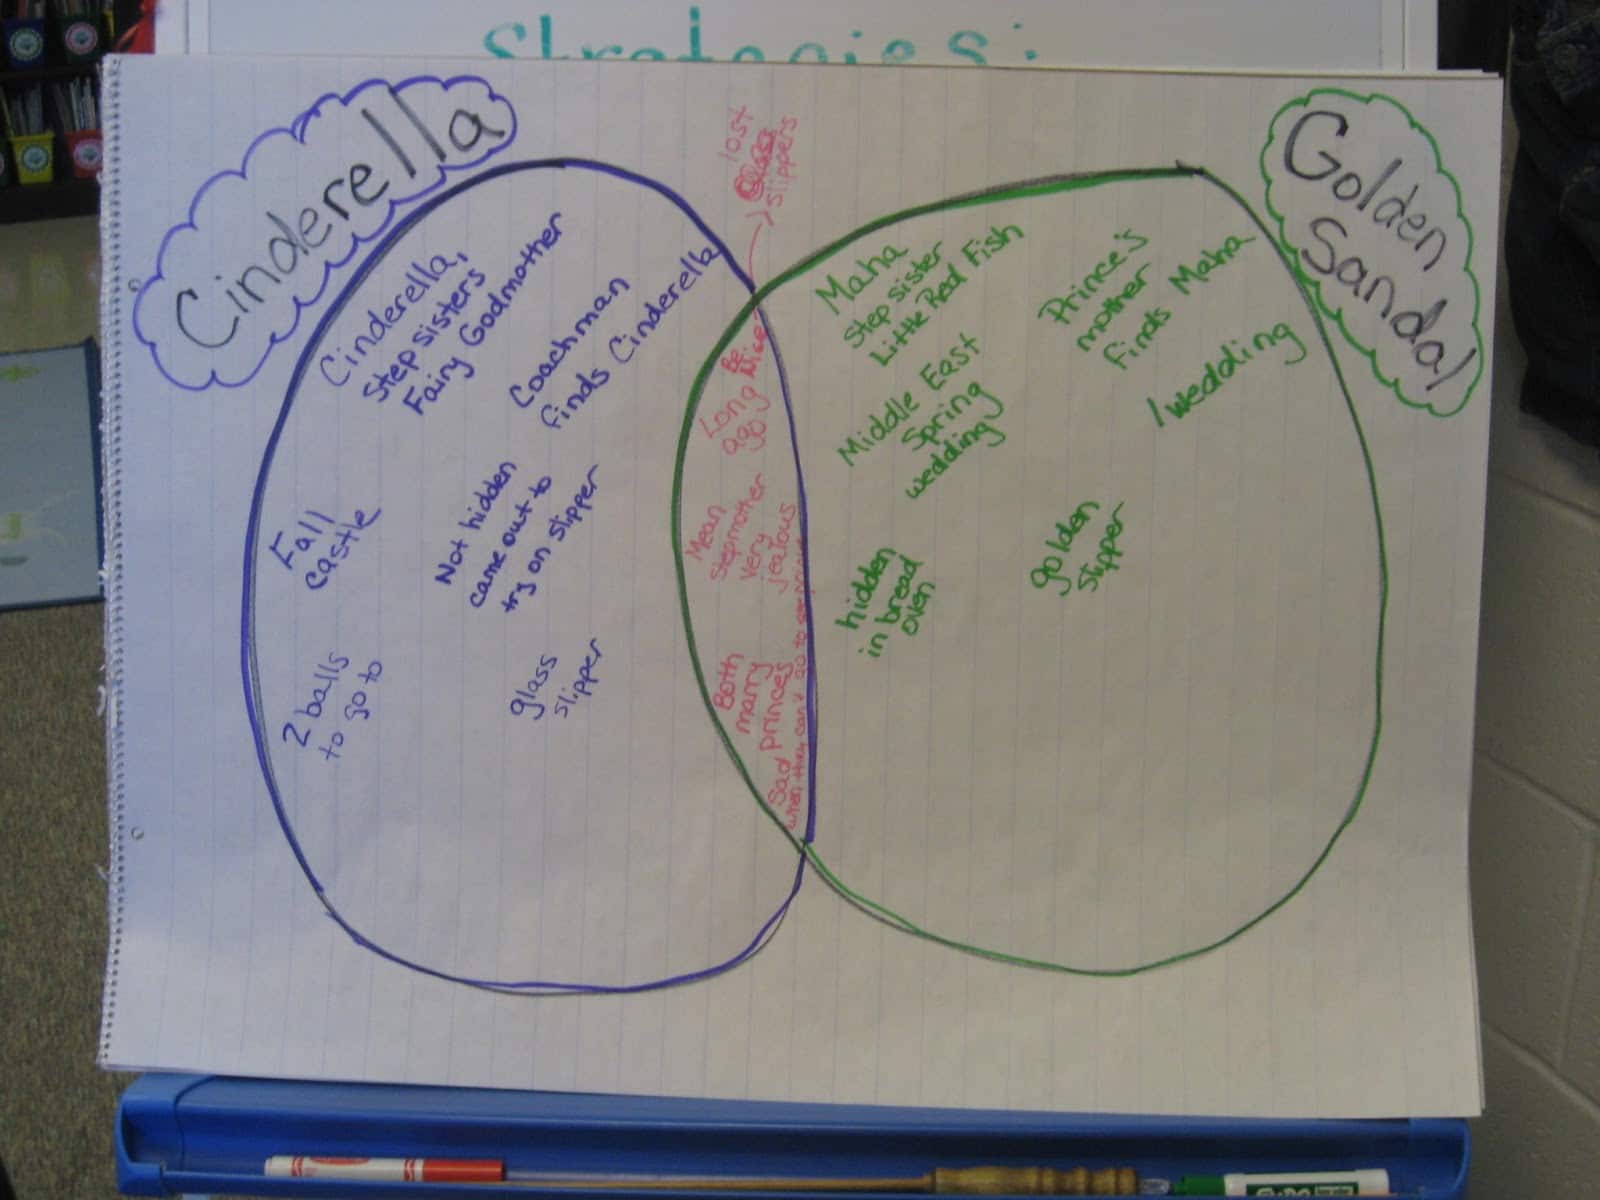
The new second grade Common Core Standards states that students “Compare and contrast two or more versions of the same story (e.g., Cinderella stories) by different authors or from different cultures. (CCSS.ELA-Literacy.RL.2.9 ). While the Venn diagram is certainly a way to help student’s organize their thinking when comparing and contrasting, I get tired of it! I wanted a more structured way to compare and contrast stories that ALSO hit more that one standard.
I have also noticed that for many students the venn diagram is a great way to record thinking but doesn’t always lead to the most meaningful comparisons.
My district shared this simple chart and I LOVED it! It also hit the standards
- Describe the overall structure of a story, including describing how the beginning introduces the story and the ending concludes the action (CCSS.ELA-Literacy.RL.2.5)
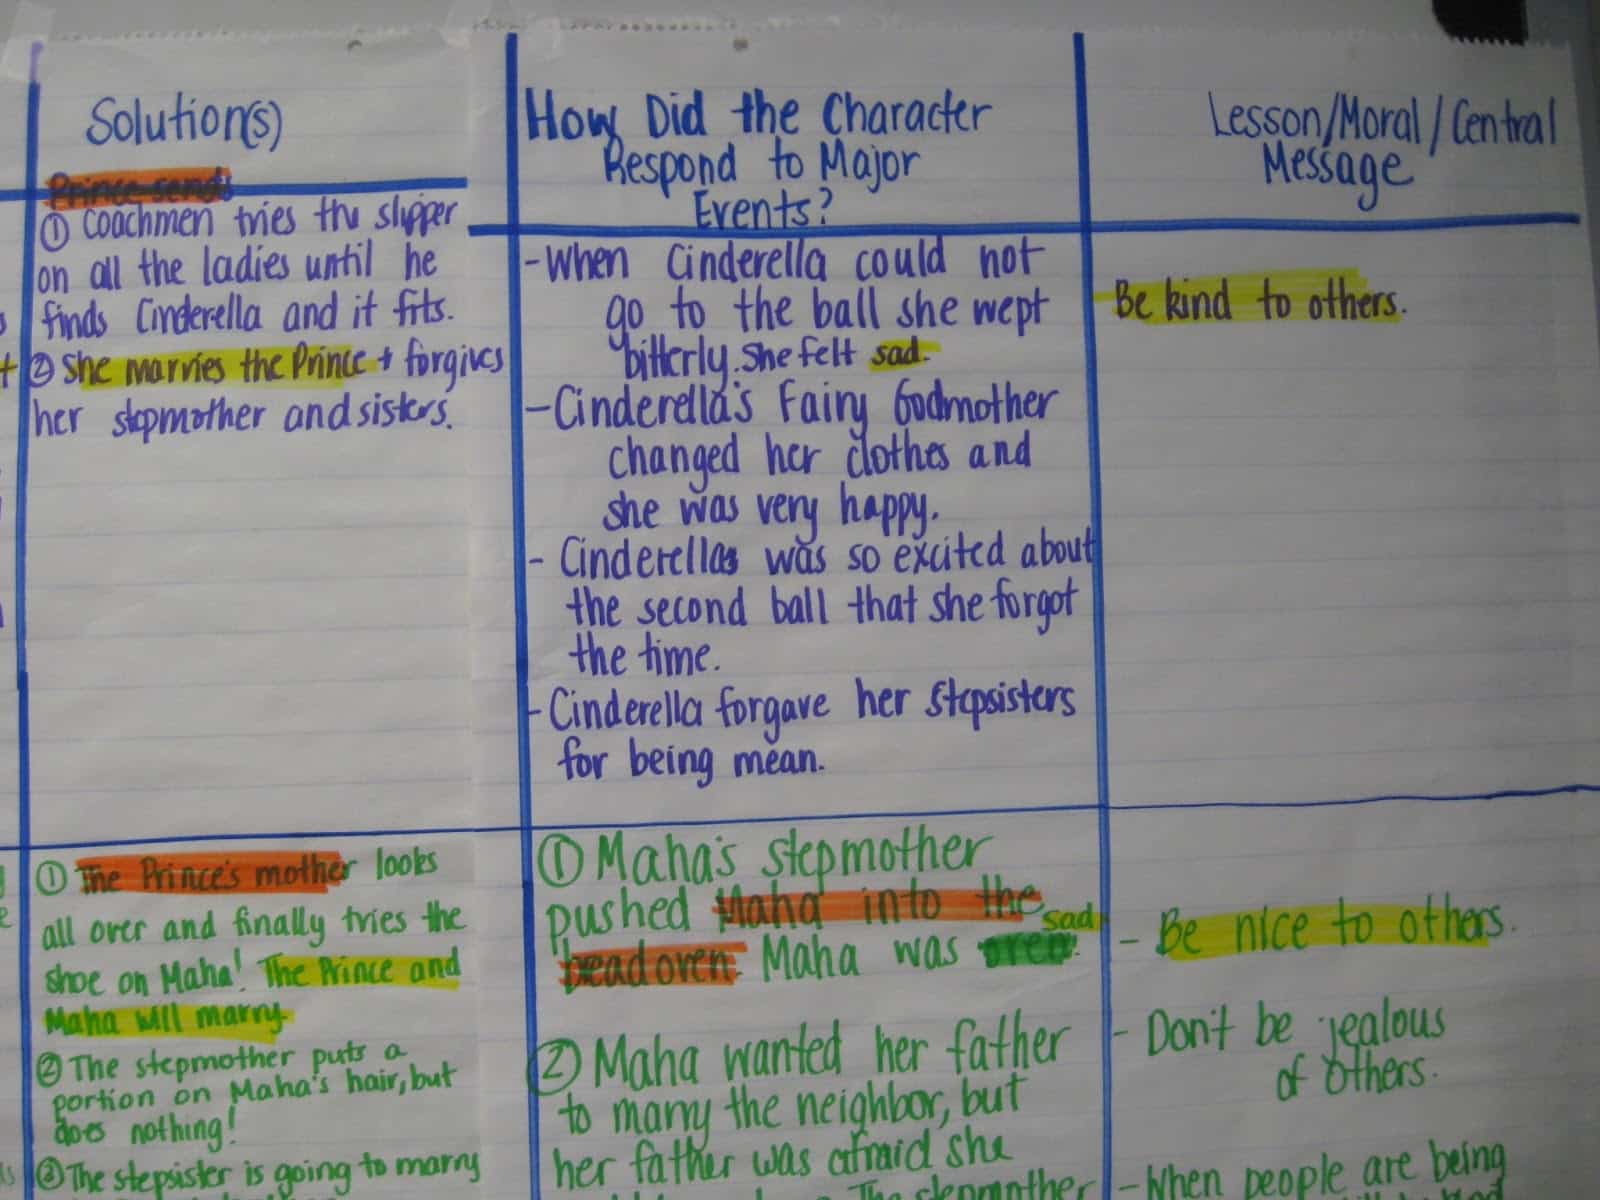
- Describe how characters in a story respond to major events and challenges (CCSS.ELA-Literacy.RL.2.3 )
and lends itself well to
- Recount stories, including fables and folktales from diverse cultures, and determine their central message, lesson, or moral (CCSS.ELA-Literacy.RL.2.2).
LOTS of bang for my buck!
I enlarged the chart and taped it up on the back white board by our whole group meeting area and our easel. Basically, I created the chart using three large sheets of chart paper.
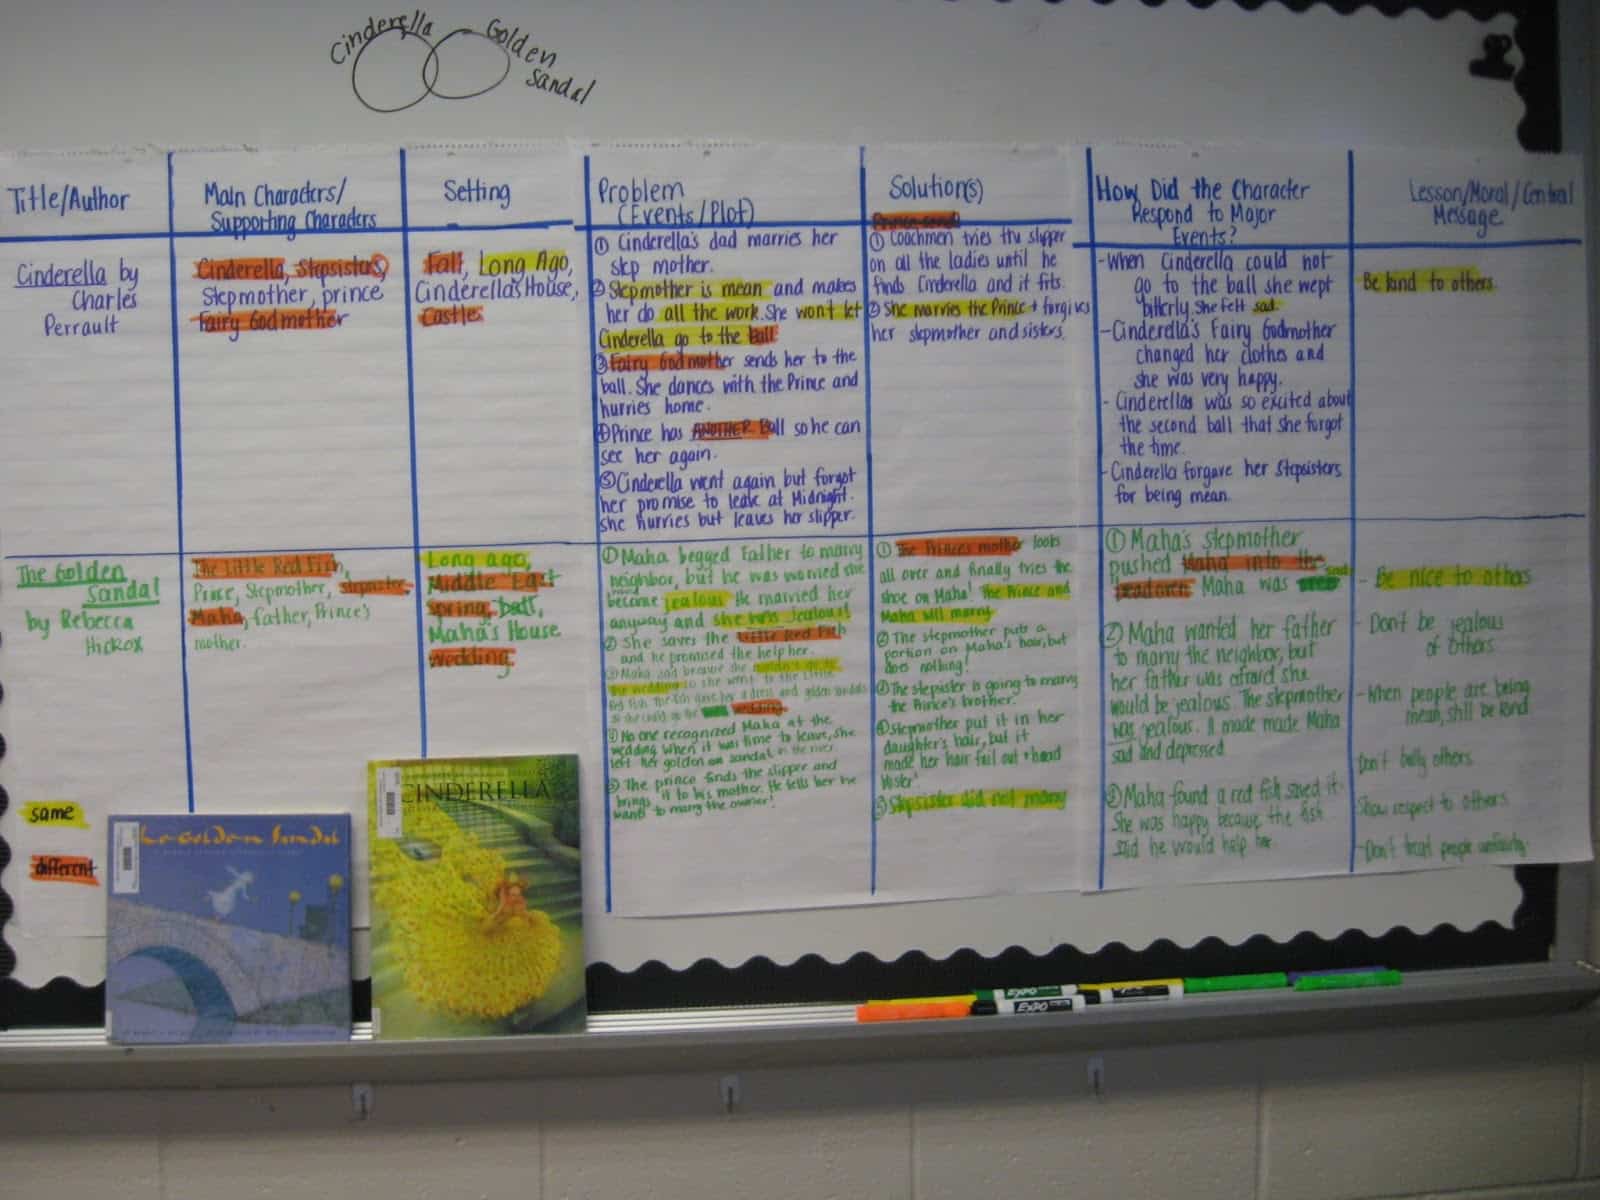
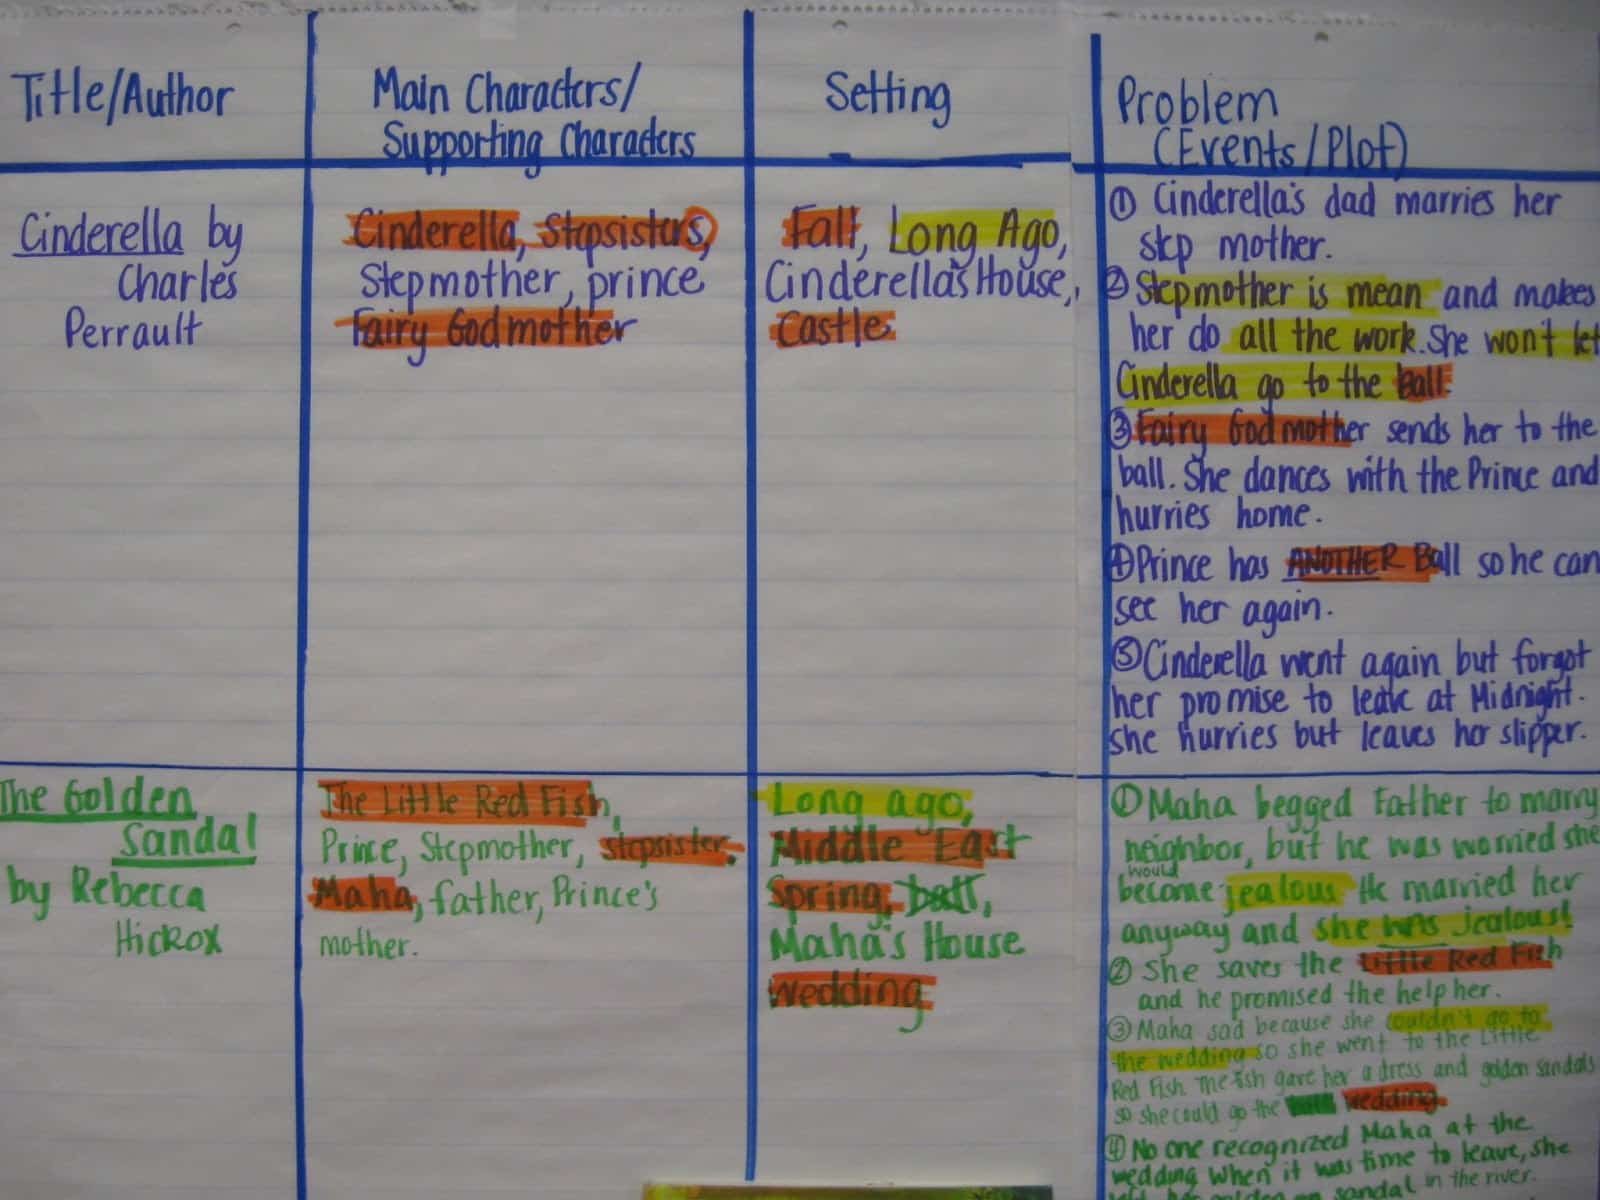
We read aloud the story Cinderella by Perrault and The Golden Sandal by Rebecca Hickox. After reading aloud each story we filled out the matching part of the chart. It took about 3 days to read, and record all the information per story.
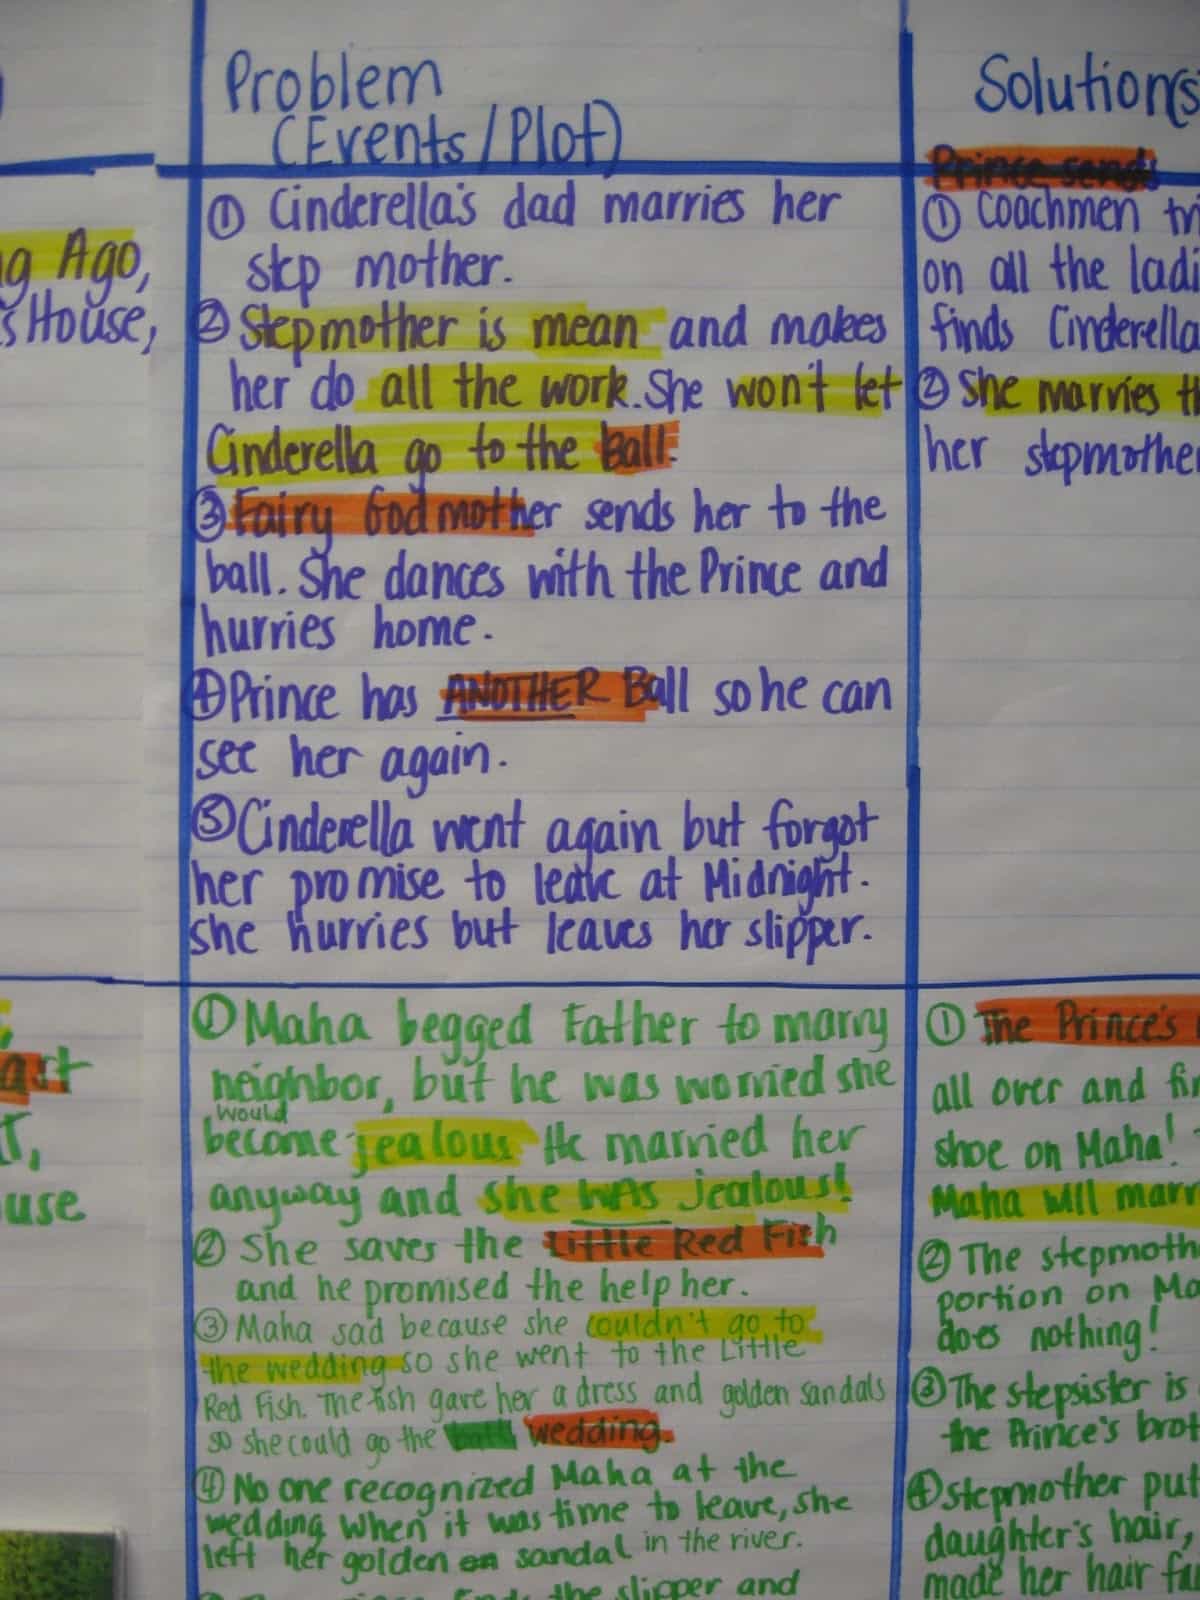
The catergories across the top are : title/ author, main characters/ supporting chracters, setting, problem/ events (plot), solution, how did the main character respond to major challenges lesson/ moral / central message.
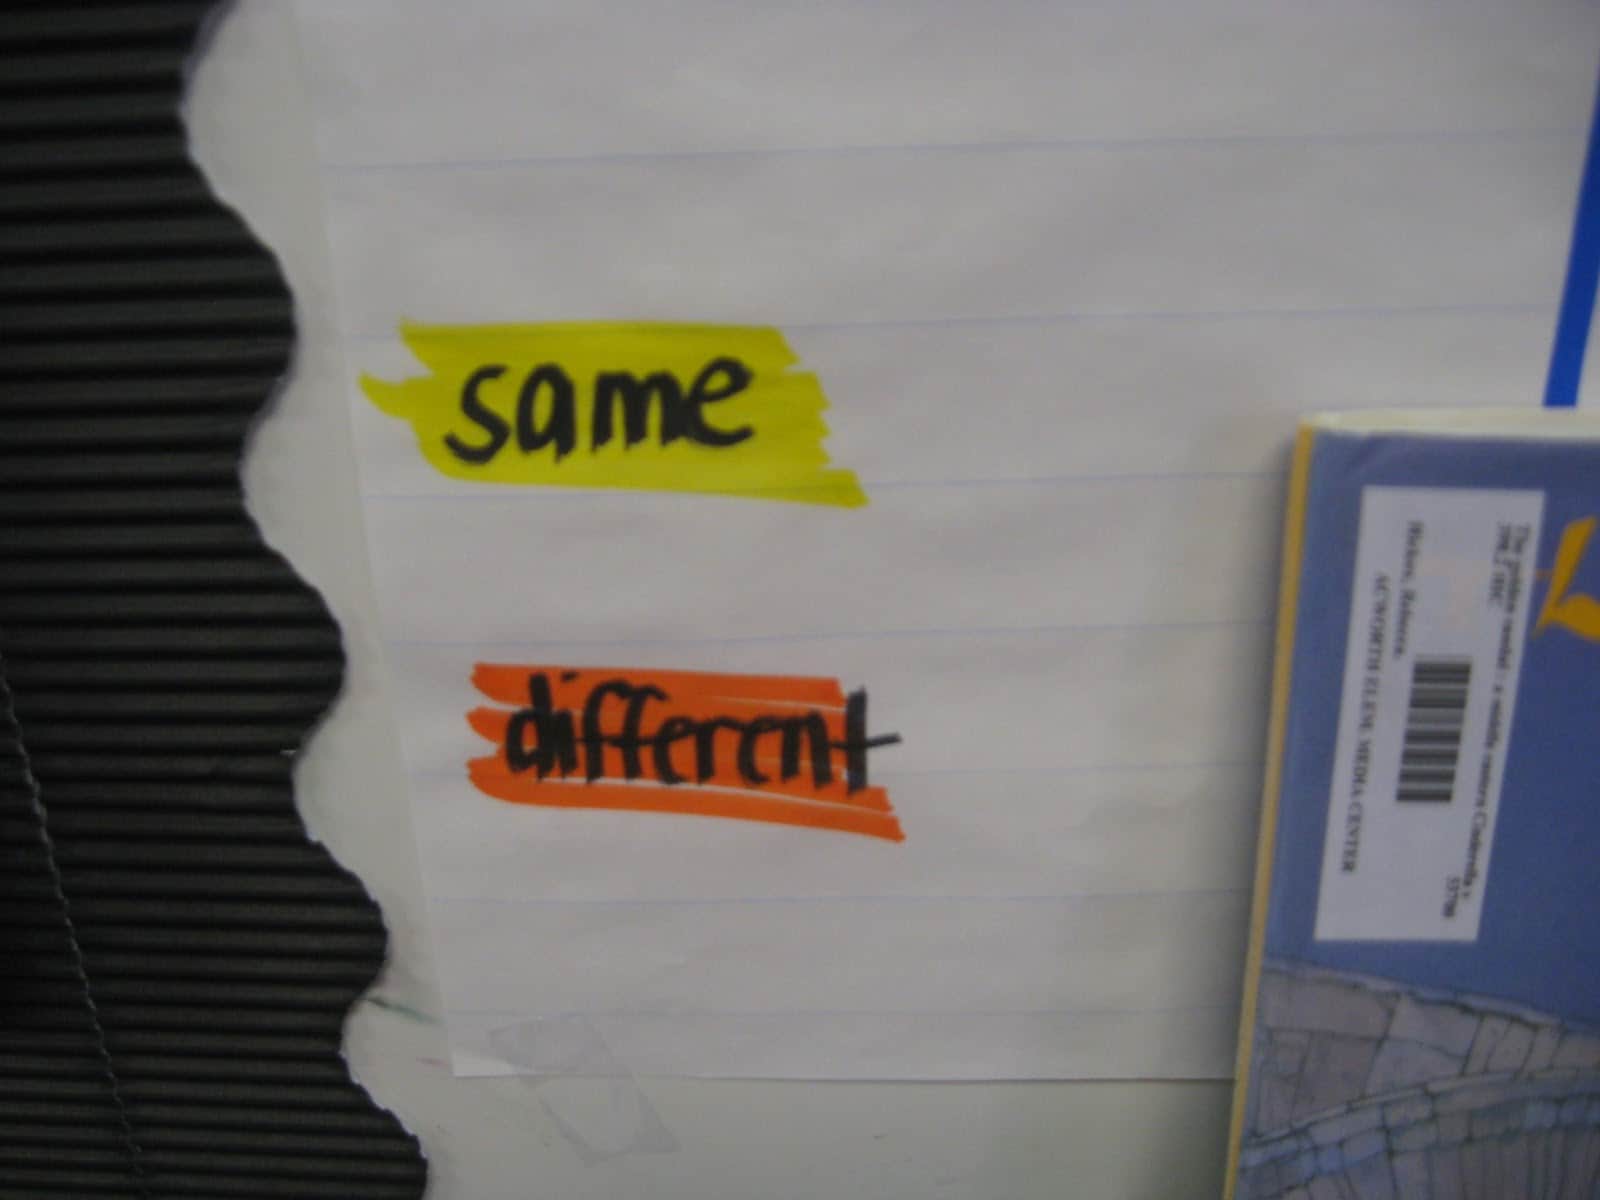
After reading and recording the information for BOTH stories, we used the chart to compare and contrast. We color coded yellow for similiarities and orange for differences. Then students used the chart and a partner to find how the stories were alike and different. We highlighted directly on the chart.
Here are a few close ups:
Also, don’t forget about the Spring Cleaning Sale!
I am joining up with several other bloggers for a Spring Cleaning Sale!
document.write(‘
Mandy Gregory is a 2007 and 2012 Teacher of the Year. She has taught Kindergarten- 4th grades in both the general education and inclusion settings. She is currently a 1st grade Special Education teacher. She is the owner and creator of Mandy’s Tips for Teachers website (www.mandystipsforteachers.com) and has over 13 years of teaching experience. She is married with two beautiful children.
I really like how you broke this standard down for the kids! Way to go 🙂 I will definitely adapt parts of this for my fifth graders next year!